

Abstract
For applications such as weather, flood, and drought forecasting that need water level estimates as soon as possible, near real-time (NRT) products are most appropriate. Unlike in-situ sensors for water level measurements, which typically deliver NRT data, satellite altimeters deliver physically meaningful observations with substantial delays after acquisition. The new radar altimetry mission, Sentinel-3, is capable of delivering NRT water levels within a few hours of observation. Currently, it remains unexplored how accurate the NRT product is in the context of river monitoring. This study assesses Sentinel-3A/B NRT products in mapping river water level variations globally. Based on a three-year comparison, we find that the water level derived from NRT is almost as good as that from the delayed products (median root-mean-square error (RMSE): 21.5 cm and 23.5 for S3A and S3B), and both products achieve very similar RMSE values (median: 52.5 cm and 59.0 cm for NRT and non-time critical) against in-situ data at 25 locations. This study highlights the usefulness of Sentinel-3 NRT product for river monitoring and forecasting. And we recommend the NRT product if latency is a primary concern.
Export citation and abstract BibTeX RIS

Original content from this work may be used under the terms of the Creative Commons Attribution 4.0 license. Any further distribution of this work must maintain attribution to the author(s) and the title of the work, journal citation and DOI.
1. Introduction
Knowledge of global surface water variations is fundamental for understanding the impacts of climate change and human activities (Crétaux et al 2011). Knowing the freshwater dynamics is crucially important to several sustainable development goals (Bhaduri et al 2016). Presently, the global hydrometric network is not keeping pace with monitoring needs and the existing networks are declining (Ruhi et al 2018). The development of remote sensing technologies offers a great opportunity to complement existing networks. One of the technologies for measuring water surface elevation (WSE) is radar altimetry, which probes the Earth's surface by measuring the travel time of a radar pulse from the satellite antenna to the surface and back to the satellite receiver. Although this technique was initially developed for oceanographic research, it has also been widely used in inland water studies, such as monitoring the dynamics of lakes and reservoirs (Calmant et al 2008, Crétaux et al 2011, Jiang et al 2017, 2020a), retrieving water level and river discharge (Kouraev et al 2004, Leon et al 2006, Tourian et al 2016, Bogning et al 2018, Zakharova et al 2020, Tarpanelli et al 2021, Kittel et al 2021b), calibration of river models (Schneider et al 2018, Jiang et al 2019b, 2021, Domeneghetti et al 2021, Kittel et al 2021a), hydrological forecasting (Hossain et al 2014, Michailovsky and Bauer-Gottwein 2014), etc.
Near real-time (NRT) monitoring of water level is essential in the context of extreme events and early warning and forecasting systems (Leben and Born 2002, Crétaux et al 2011, Allen et al 2018, Falck et al 2021). The use of NRT altimetry data for early warning systems or operational hydrological prediction is limited, although the potentials have been demonstrated (Andreadis et al 2007, Paiva et al 2013, Michailovsky and Bauer-Gottwein 2014, Falck et al 2021). Most of the existing literature explored the value of non-time critical (NTC) instead of NRT altimetry data for water level and streamflow prediction (Hossain et al 2014, Michailovsky and Bauer-Gottwein 2014, Chang et al 2019). One of the reasons has been the data latency. The NRT data latency of T/P and ERS-1&2 (1990s) was within 18 h while that of Geosat (1980s) was within 48 h (Leben and Born 2002). Since the 2000s, Jason-1 delivered scientifical NRT data within 6 h thanks to the capability to calculate orbit and process altimeter data onboard (Desai and Vincent 2003). However, there is a trade-off between data latency and data precision/accuracy needed. The NRT data provides measurements from the onboard instruments without relying on external ancillary data (Desai and Haines 2003), but suffers from low precision orbit determination (POD) and poor water level observation accuracy. With the advances of real-time POD and the capability of onboard data processing, the latest operational altimetry missions, such as SARAL/AltiKa, Jason-3, Sentinel-3, Sentinel-6, etc provide operational NRT product within 2–5 h (Haines et al 2011). Especially, the Sentinel-3 NRT product is delivered within 3 h. This product is one of the first to include primary geophysical parameters as well as the retracked range, high-rate waveforms, and geophysical corrections.
The Sentinel-3 altimetry mission has several new features. It is based on a constellation of two satellites, which optimizes spatial sampling density and temporal revisit. High resolution or SAR mode is used near globally, which improves the performance over inland water. Last but not least, an open-loop tracking is adopted as operational tracking mode. Compared to the traditional closed-loop tracking mode, which positions the current reception window based on onboard analysis of previous waveforms, an open-loop tracking facilitates the positioning based on a priori information of inland water surface height. This tracking mode greatly increases the availability and valid measurements over inland water bodies (Jiang et al 2020b, Le Gac et al 2021). Therefore, the NRT altimetry data might be beneficial to hydrological prediction or extreme events monitoring, even though it is designed mainly for marine meteorology and ocean-atmosphere gas transfer studies (Donlon et al 2012).
We assess the NRT altimetry data over rivers globally to characterize its usefulness for real-time river applications. However, in-situ data are scarce and not publicly accessible, especially in such large scale. To achieve this, we compare river WSE derived from NRT with that from the NTC, which is the most accurate product and has been widely validated showing the root-mean-square error (RMSE) ranging from a few centimeters to a few decimeters (Gao et al 2019, Jiang et al 2020b, Kittel et al 2021b, Halicki and Niedzielski 2022). In addition, validation against in-situ data at 25 locations is also carried out to further assess the quality of both products.
2. Data and methods
2.1. Data
Sentinel-3A (S3A) and Sentinel-3B (S3B) were launched in Feb 2016 and Apr 2018, respectively. Both satellites are in a sun-synchronous orbit with a repeat period of 27 d, which results in an across-track distance of 104 km at the Equator. Therefore, the two satellites densify the single satellite ground track pattern by halving the across-track distance, i.e. 52 km.
There are three data products of S3 altimeter depending on the latency, that is, NRT delivered within 3 h, slow-time critical delivered within 48 h, and NTC delivered within 1 month. The major difference between NRT and NTC includes the consolidation of auxiliary and ancillary data, such as precise orbit data, platform, corrections for the wet and dry troposphere. NTC takes 28 d to allow for more accurate GPS orbits, clocks, and satellite biases etc to achieve 3 cm radial RMS, while NRT POD is available 30 min with an accuracy of 10 cm.
We collected S3 NRT and NTC level-2 land product from the Copernicus Open Access Hub https://scihub.copernicus.eu/dhus/#/home. Due to the short retention (one month) of NRT product, we periodically downloaded NRT data since 2020. We used three-year data of 2020–2022 for both S3A and S3B in this study to achieve a comprehensive comparison. Moreover, NTC data over the entire period (i.e. 2016–2022) at some virtual stations (VSs) (the intersection of a ground track and a river reach, analogy to hydrometric station) were also used for further analyses, e.g. extreme event detection described in section 2.4.
To validate the quality of both products, we collected in-situ water level data of 25 gauging stations across US, India, and China over the same period, i.e. 2020–2022.
2.2. Data processing
Firstly, we follow the equation below to derive WSE for each observation,
where, WSE is the water surface elevation referenced to WGS84 ellipsoid and EGM2008 geoid, h is the height of satellite, Runc is retracked range without geophysical and atmospheric corrections, Rgeo is the sum of geophysical and atmospheric propagation corrections (including pole tides, solid earth tides, ionospheric delay, and dry and wet tropospheric delays), and N is the geoid height.
Since we are interested in the WSE of rivers, time series of WSE from both NRT and NTC were created at VSs globally. To obtain that, VS were created by intersecting the nominal S3 ground tracks with river centerlines from the Global River Widths from Landsat database (Allen and Pavelsky 2018). This results in more than 80 000 VS, which is a daunting task if these are all considered. Given that, we focused on VS where the river is wider than 1 km and excludes tidal rivers and canals. The data processing below is based on 3500 VS globally.
To build the WSE time series for each VS, we followed the procedures below. Individual observations at each VS were preselected based on the distance between observations and river centerlines. To avoid the exclusion of observations of wider rivers, a conservative threshold of 5 km was used. To exclude the observations over non-water targets, the water occurrence (>20%) from the Global Surface Water Explorer (Pekel et al 2016) was used. The datasets were based on more than 3 million Landsat images from 1984 to 2021 and provided statistics on the extent and change of water surfaces at 30 m resolution. The water occurrence indicates the percentage occurrence of water. This low threshold (20%) was chosen to ensure all valuable data were selected to include seasonal water. Given that the 5 km threshold may include valid observations from other targets instead of the VS only that we are interested in, a digital elevation model (DEM)-based procedure was applied. That is, all observations with occurrence >20% were compared with the multi-error-removed improved-terrain DEM (Yamazaki et al 2017) value of the VS (ΔH < 10 m). To further remove outliers, for each pass, the observations were first filtered using the interquartile range (25%–75%), which reduced the number of observations by 7.66%–7.79% depending on mission and product type. The remaining observations were further processed using the median absolute deviation following Jiang et al (2019a). The final WSE of one certain time instance (i.e. a pass) was represented by the median of all valid observations from that pass. Note that we only kept WSE with no less than 3 observations in one pass. No smoothing was applied to the final WSE. We applied the same processing for both the NRT and NTC data.
2.3. Comparison metrics
For each pass (i.e. time instance), the along-track standard deviation (STD) was calculated to evaluate the precision of measurements, that is, the smaller STD, the higher the precision. The difference between the two products was calculated by the median of all valid observations of one pass. At each VS, the time series of NRT was evaluated against that of NTC. Performance is indicated by the RMSE.
For the validation against in-situ data, the RMSE was calculated using the anomalies of each time series given that the datums of in-situ data and altimetry data are not the same. Since the gauging stations are not at the same locations of VS, gauging stations were selected using a 30 km buffer centered at each VS.
2.4. Extreme events detection
One of the added values of the NRT product is for early warning of extreme events, such as floods and droughts. In this study, we selected three rivers (i.e. Amazon, Congo, and Brahmaputra) on purpose to illustrate the usefulness of such product for extreme events detection and early warning. The media reported events over these rivers could validate the altimetry monitoring given the lack of in-situ data.
Due to the lack of in-situ records, we use a simple threshold-based approach to detect extreme events. Specifically, based on the NTC observations during 2016–2022, we first calculate the median WSE and the associated STD on a monthly basis at each VS, which serves as a benchmark. In this way, we are able to detect extreme floods and droughts in NRT based on NRT measurements. That is, an event with water level beyond the threshold (median ±1 SD) is treated as an extreme event.
3. Results
3.1. Global statistics
Figure 1 displays the statistics derived from NRT against that from NTC based on 59 052 and 58 832 WSE observations from S3A and S3B, respectively. The quality of WSE is investigated in terms of the STD of 20 Hz along-track measurements as shown in figures 1(a) and (d). Clearly, the highest density is around 20 cm as visually indicated by the density plots. In general, the STD values of 73.1% and 73.3% observations for NRT and NTC are smaller than 50 cm for S3A, while the corresponding values are both 73.1% for S3B. The median NRT STD and NTC STD are 24.3 cm and 24.4 cm for S3A, and 23.3 cm and 23.3 cm for S3B, respectively. Therefore, the precisions of both products are essentially similar. No pronounced improvements of NTC against NRT are observed (figures 1(a) and (d)).
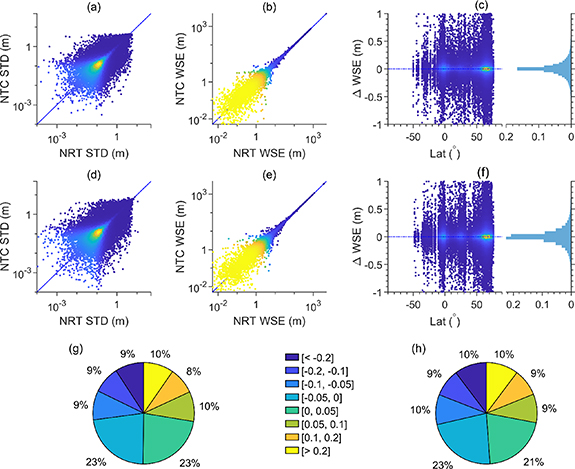
Figure 1. Comparisons of NRT and NTC of S3A (a)–(c), (g) and S3B (d)–(f), (h) in terms of data precision, i.e. density (blue-yellow) plot showing the standard deviation of the 20 Hz along-track measurements (a), (d), WSE (b), (e), distributions of ΔWSE (WSE_nrt minus WSE_ntc) along latitude and the associated histogram (c), (f), and magnitudes (m) and proportions of ΔWSE (g), (h).
Download figure:
Standard image High-resolution imageThe SWE range of investigated VS is broad, varying from nearly 0 to over 1000 m. The NRT and NTC WSE pairs are well distributed along the 1:1 line for both S3A and S3B, showing a good agreement between NRT and NTC, and no systematic bias is found (figures 1(b) and (e)). On average, the WSE difference between NRT and NTC, i.e. ΔWSE, is trivial for both S3A and S3B. The median ΔWSE is less than 2 mm (S3A: 0.2 mm, S3B:− 1.6 mm). ΔWSE is not latitudinally uniform. It spreads out around 3°S and 65°N, and larger values are observed at these latitudes (figures 1(c) and (f)), which might be attributed to the density and complexity of rivers. As shown in figures 1(g) and (h), 81.2% and 79.5% ΔWSE are within a range of [−20, 20] cm, for S3A and S3B, respectively. Over 60% ΔWSE (64.2% and 62.1% for S3A and S3B, respectively) are very small (abs(ΔWSE) < 10 cm), which is smaller than the median data precision (i.e. 20 Hz along-track STD, ca. 24 cm, see above for details). In addition, it can be seen from the histograms (figures 1(c) and (f)) and pie charts (figures 1(g) and (h)) that ΔWSE basically follows the normal distribution for both S3A and S3B.
3.2. Assessment at VS
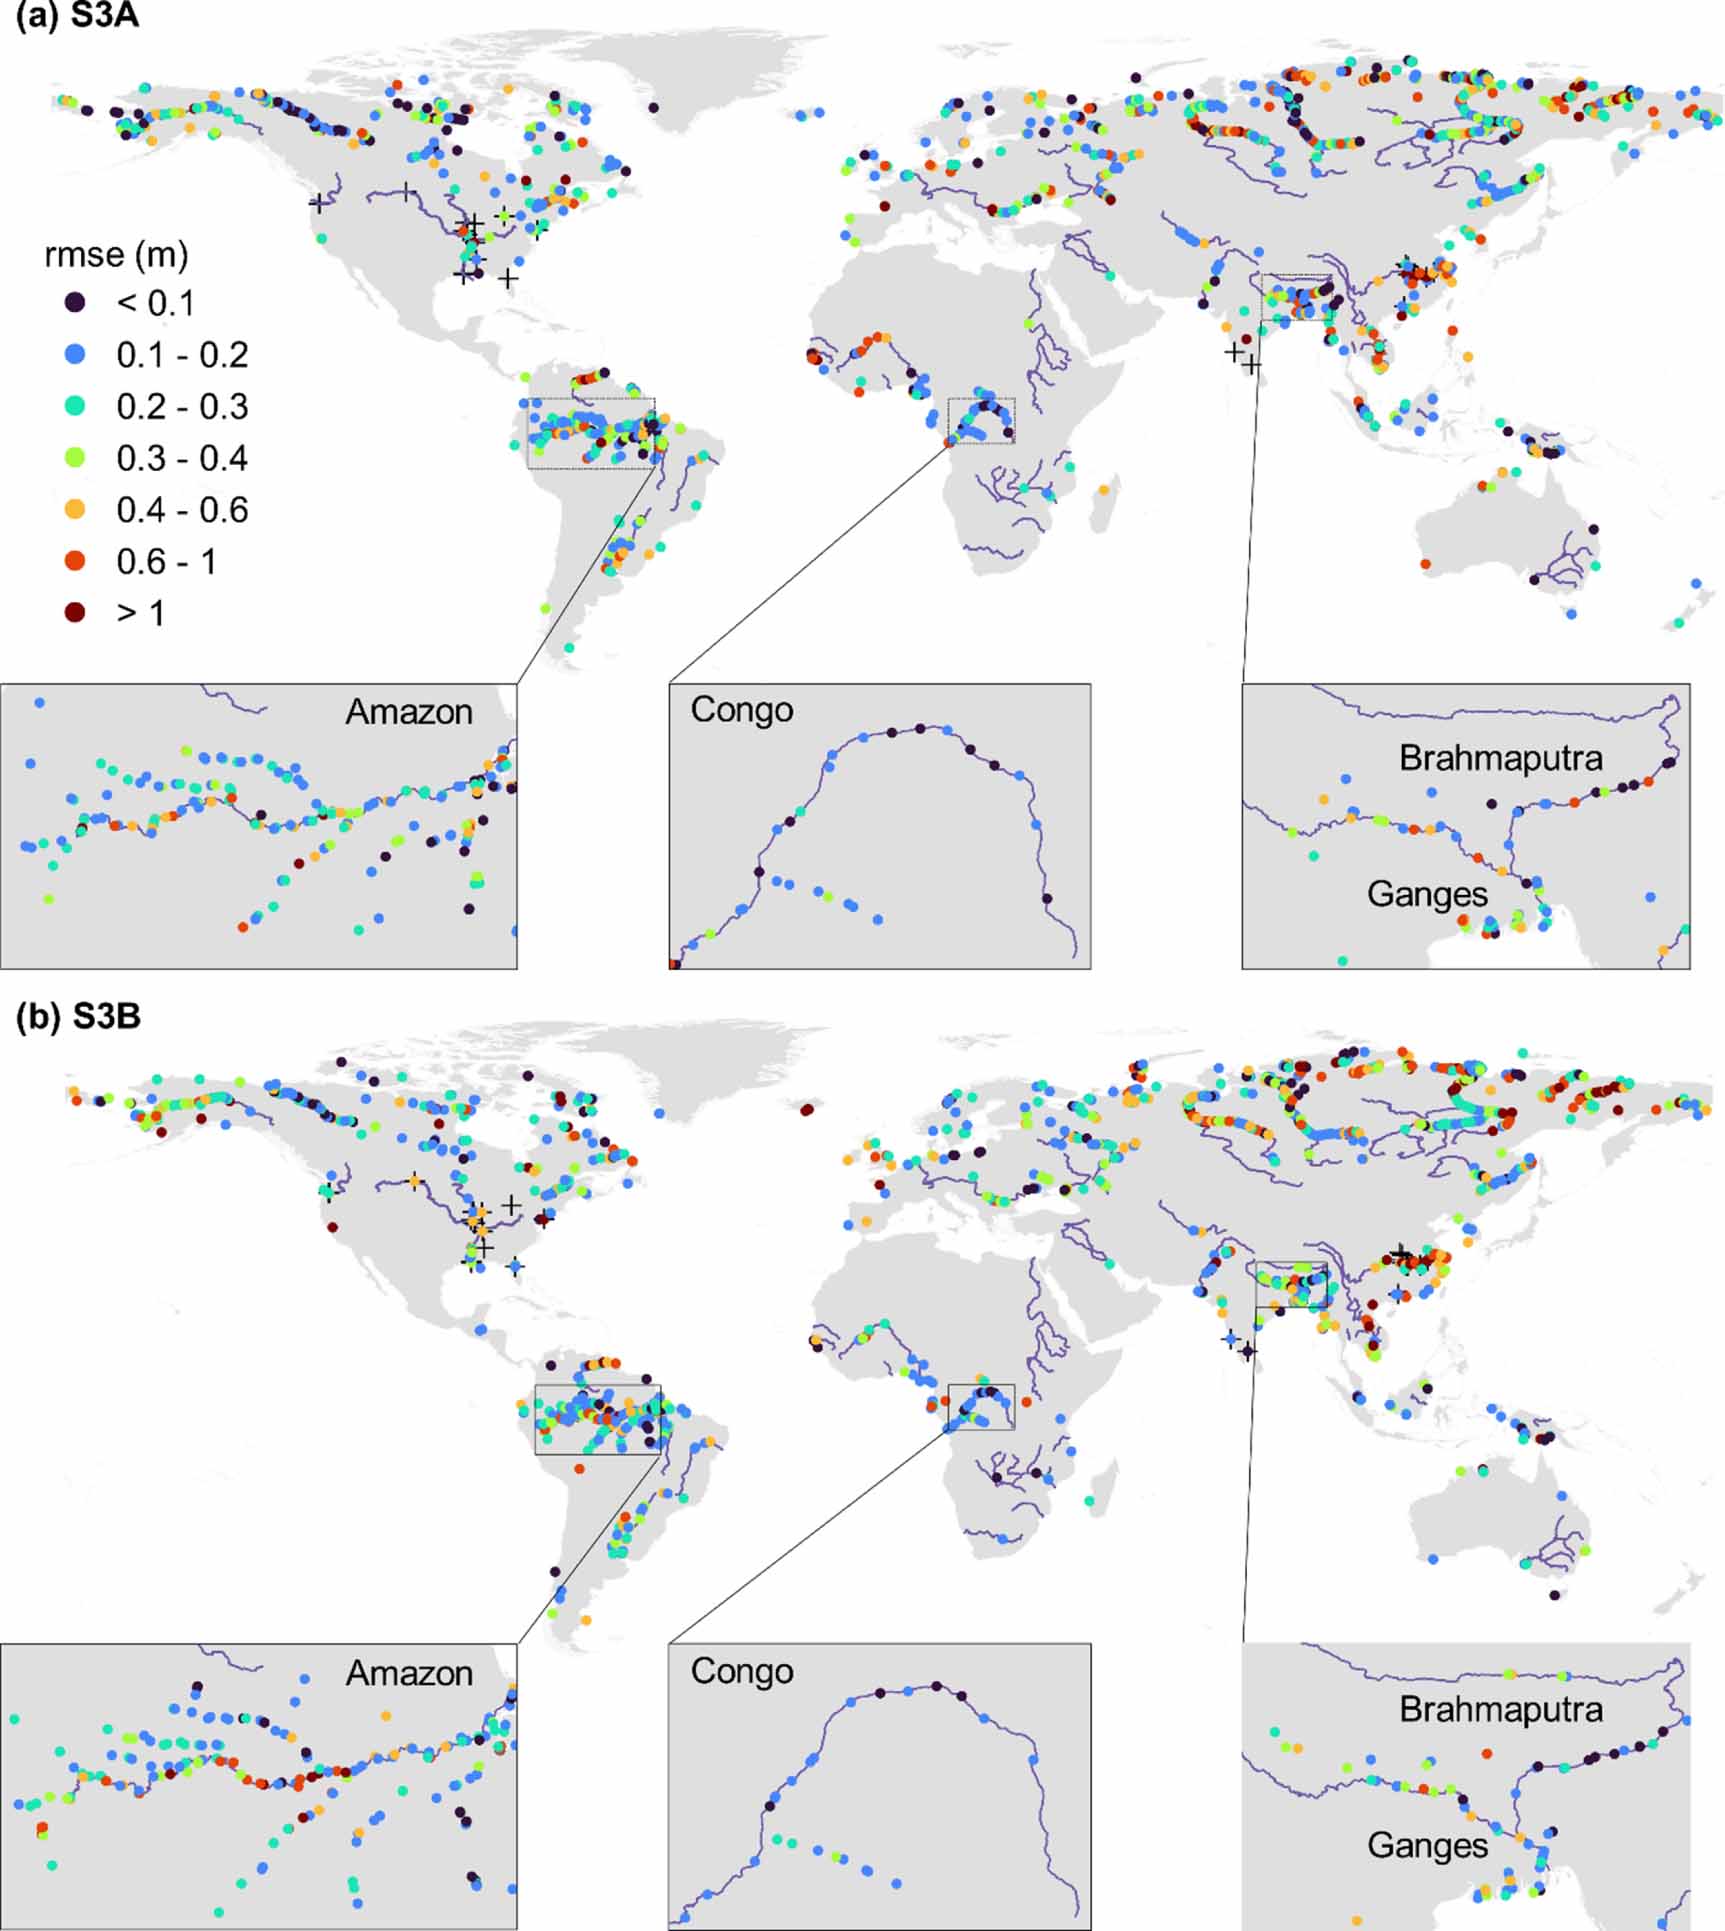
We have constructed WSE time series from NRT and NTC products at 3277 VS globally, with an observation frequency (i.e. time series length) of 35 and 36 times for S3A and S3B during 2020–2022, respectively. Figure 2 shows the VS distributions and their RMSE of WSE time series between NRT and NTC. The global distribution of RMSE values does not suggest any strong geographic biases, although there are concentrations of lower RMSE over some larger rivers.
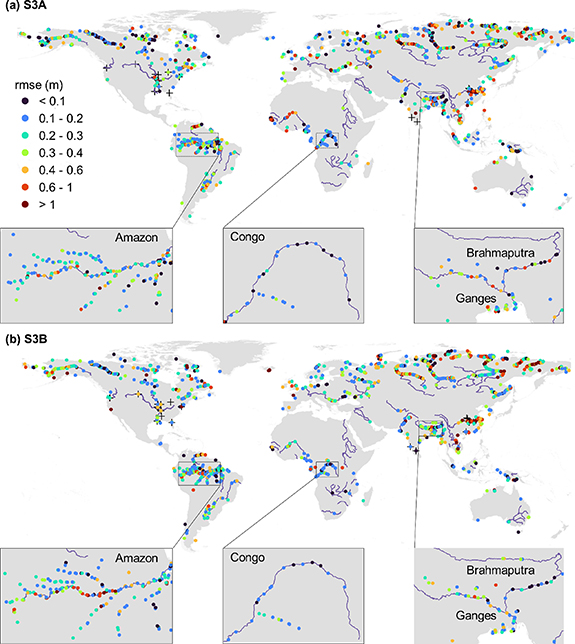
Figure 2. Overview of the virtual stations (VSs) evaluated and the RMSE of river WSE time series between NRT and NTC products for (a) Sentinel-3 A and (b) Sentinel-3B. Crosses indicate the locations of in-situ gauging stations. Insets show the zoom-in view of evaluation over three large rivers.
Download figure:
Standard image High-resolution imageStatistically, the median RMSE of 1655 S3A VS is 22.2 cm. The 62.3% VS show a good agreement between NRT and NTC products, with an RMSE less than 30 cm. This accuracy level is on par with previously reported RMSE, i.e. <40 cm, indicating no significant difference between the two products. These VS are distributed across six continents. Slightly larger RMSE values (>1.0 m) are seen at 3.6% VS that are mainly located in the coastal areas and largely affected by tides (figure 2(a)). Regarding S3B, the median RMSE of 1622 S3B VS is 23.5 cm. And 61.5% and 6.8% VS have RMSEs smaller than 30 cm and larger than 1.0 m, respectively. In general, the NRT products of S3A and S3B are of no difference by referencing to their counterparts. Their performances are consistent, and the spatial patterns are very similar (figure 2). For instance, the RMSEs of VS in the Amazon basin from S3A and S3B are very similar and generally below 30 cm. Similar cases can be seen in the Congo and Brahmaputra basin (figure 2).
A closer look at the VS with larger RMSEs (i.e. >1 m) reveals unreasonable values and extreme values (e.g. larger deviations from DEM). The former is largely attributed to onboard tracking issues, and the latter is attributed to the simple outlier removal procedure (see figure S1). Moreover, in some cases, such as the Yangtze river, waveform data are very complex, which cannot be effectively processed with default retrackers (Jiang et al 2020b). Assessment based on the median ΔWSE of time series at each VS also shows a good agreement between NRT and NTC products (figure S2). Note that the investigated VS are from large rivers. Compared to the annual amplitude (on average 4 m, estimated by the 10%–90% quartile range), the median RMSE values are relatively small, equivalent to a few percentages of the mean annual amplitude.
3.3. Validation against in-situ data
To have a better understanding of the quality of both products, validation against in-situ data was carried out at 25 VS. These stations are located in China (8), India (2), and US (15) as shown in figure 2. Overall, both NRT and NTC correlate well with in-situ data as shown in figure 3. The NRT is very similar to NTC in terms of the RMSE against in-situ data, i.e. 52.5 cm and 59.0 cm for NRT and NTC, respectively. As shown in figure 3, the RMSE values have relatively broad ranges for both NRT and NTC. This can be explained by a few reasons. Firstly, one needs to be aware of the non-overlapping locations of in-situ gauging stations and VS. The distance between them affects the RMSE values. A detailed description of all the 25 pairs of in-situ stations and VS is summarized in table S1 in the supporting materials. Secondly, the environment around a certain VS can have large impacts on altimetry observations, for both NRT and NTC data. For instance, the larger RMSE values are from China, i.e. VS located at the Yangtze River, over which the altimetry observations are very noisy due to the ships and complexed water environments. Given that, the RMSE values may be overestimated, and should be taken as conservative upper bounds. Nevertheless, the RMSE values are well within the range of previously reported values (Jiang et al 2020b, Kittel et al 2021b, Halicki and Niedzielski 2022).

Figure 3. Validation of NRT and NTC against in-situ data at 25 stations. (a) Boxplot of RMSE values, (b) a scatterplot with a 1:1 reference line plotted for NRT observations against in-situ data, (c) a zoom-in plot of the rectangle marked in (b), (d) similar to (b) but for NTC observations, and (e) similar to (c) but for NTC.
Download figure:
Standard image High-resolution image3.4. Flood and drought monitoring
Timely information of WSE is important to support extreme events detection and early warning. We demonstrate this by analyzing NRT WSE dynamics in the three large rivers (i.e. Amazon, Congo, and Brahmaputra) as highlighted in figure 2.
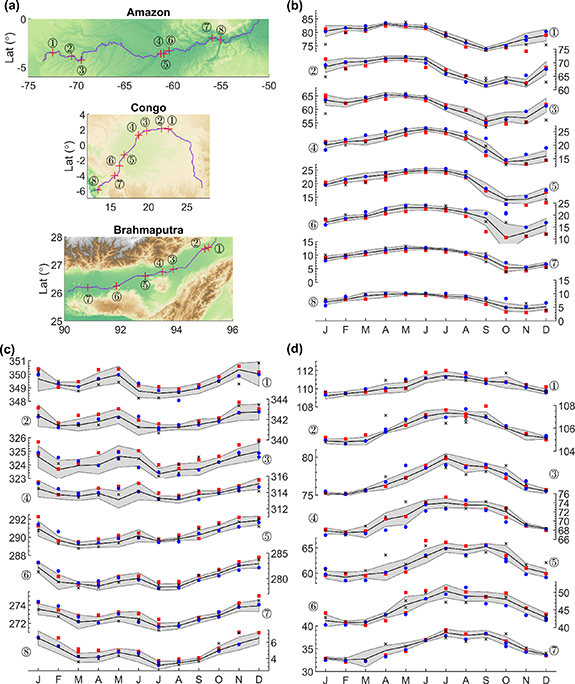
As shown in figure 4, eight VS are located at the Solimões (the upper Amazon river) and were selected to show the spatio-temporal dynamics of WSE. Clearly, the timing of peak and low WSE varies from the upstream to the downstream (figure 4(b)) and the water levels of downstream and upstream VS are lag correlated. This is especially useful for forecasting downstream flood events. This is in line with the case demonstrated in the study by Biancamaria et al (2011) although they used the NTC product. Moreover, the NRT time series of Amazon (figure 4(b)) shows that year 2021 (blue dots) is much wetter than 2020 (red squares) and the WSE is much higher than normal. Especially, WSE peaks in year 2021 at VS 4, 5, and 6 are exceptional, indicating severe floods. WSE in May and June are above the critical threshold of 19.6 m at Manacapuru station (located between VS 5 and 6), which is treated as severe flood stage according to the Brazilian Geological Survey—CPRM (www.cprm.gov.br/en/). Actually, this flood event sets a new record of extreme floods (Espinoza et al 2022). On the contrary, 2020 is much drier than normal, especially during September to December 2020, which is revealed by the NRT WSE shown in figure 4(b). The year 2022 turned to dryer after enduring floods, especially after September as illustrated in figure 4(b). It should be noted that, due to the short length of records and large interannual variability over this period (S3A, 2016–2022, figure S3), the estimated benchmark (mean and STD) might be overestimated compared to that calculated using long-term (say 30 years) records, and the STDs should be viewed as an upper bound on the historical likelihood of annual water level fluctuation. In this regard, the WSE of year 2021 is not far beyond the upper bound (grey shaded area) as shown in figure 4(b) but is actually extreme.
Figure 4. Near real-time monitoring of water level at three rivers (a) river settings and location of VS (labeled with circled numbers from the upstream to the downstream in ascending order), NRT water level (y-axis in meter, x-axis in month) at each VS of the Amazon river (b), Congo river (c) and Assam valley of the Brahmaputra river, against historical statistics derived from NTC data. Note that, the black line indicates the median value and grey zone indicates one standard deviation. And red squares, blue dots, and black crosses are NRT observations in years 2020, 2021, and 2022, respectively. Since the repeat period is 27 d, there might be two observations in some months.
Download figure:
Standard image High-resolution image
An extreme flood occurred during November to December 2020 in the Congo river (red squares in figure 4(c)). The WSE is generally beyond the upper bounds of the multiple year average, especially at the most downstream VS (VS 7 and 8). Together with the flood in April 2020, thousands of people were affected including deaths and injuries according to the World Food Program (www.wfp.org/). On the contrast, years 2021 and 2022 are relatively drier, which led to very low WSE in 2022, especially at the upstream VS.
Similarly, we identified flood events of the Brahmaputra in the Assam valley during May to July 2020, especially at VS 5 and 6 (red squares in figure 4(d)). According to the Assam State Disaster Management (ASDMA) authority, more than 20 000 people were affected by this flood. Coincidentally, a deadly flood event can be identified in April 2022 (black crosses in figure 4(d)). According to ASDMA, 179 people lost their lives due to this event and associated landslides. NRT observations of WSE can quickly identify floods in hours instead of weeks, and enable authorities to relocate people at risk during such events.
The above analyses of river dynamics demonstrate that using satellite NRT data, we can detect extreme floods and thus assist in flood emergency responses. Moreover, NRT water level has various time-critical applications beyond NRT monitoring of river dynamics. For instance, NRT water levels can be included in operational hydrodynamic models providing the flow wave travel time (Trigg et al 2009), which is of great value for making an evacuation plan.
4. Summary and discussion
Sentinel-3 provides a NRT product within 3 h after acquisition and a NTC product with nearly 1 month delay. How much accuracy of NRT data is lost given such a short latency? The central objective of this study is therefore to assess the Sentinel-3 NRT altimetry products over rivers globally.
An assessment at 3277 river VSs indicates that the NRT product is of high quality, and matches well with the final product, i.e. NTC product with average RMSE of <30 cm. The median absolute difference between NRT and NTC, i.e. ΔWSE is less than 2 mm. The precision of both products is essentially similar in terms of the along-track STD of the 20 Hz measurements. The median NRT STD and NTC STD are 24.3 cm and 24.4 cm for S3A, and 23.3 cm and 23.3 cm for S3B, respectively. Moreover, in terms of the WSE difference (ΔWSE) between NTC and NRT products, 81.2% and 79.5% ΔWSE of S3A and S3B are within a range of [−20, 20] cm, which is small compared to the data precision (the median STD around 24 cm, detailed in section 3.1). Moreover, no systematic bias is found and ΔWSE basically follows the normal distribution. Validation against in-situ data at 25 locations in the US, India, and China shows that both products achieve very similar RMSE values, with the median of 52.5 cm and 59.0 cm for NRT and NTC, respectively. These values are comparable to widely reported RMSE values (Gao et al 2019, Jiang et al 2020b, Kittel et al 2021b, Halicki and Niedzielski 2022). Correlation analyses do not show difference between the two products against in-situ data. In this regard, the NRT product is of no difference from the NTC product. It should be noted that these results are conservative and could be better if more advanced data processing techniques (such as tailored retracking instead of default retracker) are used.
In this study, we gain new knowledge about the NRT altimetry products for hydrological studies. Satellite altimetry can be used to retroactively study the historical hydrological phenomena, but also to monitor water bodies in NRT and inform early warning systems, reservoir operations management, and hydrological and hydrodynamic models taking into consideration of the data quality and timeliness. For instance, forecasting downstream water levels could be achieved using upstream NRT water levels. This is extremely valuable in the transboundary river basins (Biancamaria et al 2011). Moreover, assimilation of such observations could improve the performance of the hydrological models and thus provide useful hydrological forecasts as demonstrated in previous studies (Pereira-Cardenal et al 2011, Paiva et al 2013).
The results presented in this study are informative for both the hydrology community and satellite data providers. NRT data are now of such high quality that they could be used in hydrological applications, especially for forecasting purposes, as they are nearly as good as NTC data. Such timely information is of great importance in the context of flood emergency response. We therefore recommend using such data products for e.g. extreme flood monitoring, especially in poorly-gauging river basins. More efforts have to be put to increasing the awareness and the accessibility of such high-quality data in the hydrology community.
Acknowledgments
This study was financially supported by the SUSTech research startup Grants (Y01296129; Y01296229) and the CRSRI Open Research Program (Program SN: CKWV20221009/KY). We thank the reviewers for providing insightful comments that help improve the manuscript.
Data availability statements
All data that support the findings of this study are included within the article (and any supplementary files).
Supplementary data (0.8 MB PDF)